
"It used to cost less." You've heard it a hundred times, maybe said it yourself. And yet the statistics keep saying that purchasing power has risen. Both can't be true at the same time, can they?
Freedom is a number.
At ExSys, we build tools that make your financial future readable, we write articles that explain how money and the economy really work, and we give you what you need to manage your portfolio yourself.
Today: what your money really buys, according to Insee's series (the French statistics office) and our free Purchasing power tool.
Has the minimum wage kept up with prices?
Two definitions first, so we're talking about the same thing. The SMIC is France's legal minimum wage: the least an employer is allowed to pay for an hour of work. Here we use the gross hourly SMIC, before social contributions. And when we talk about "prices", we mean Insee's consumer price index, the one quoted for inflation. It tracks the price of a large fixed basket of goods and services, not what each person actually spends.
Between 1970 and 2025, the gross hourly SMIC was multiplied by 22.8. Prices, by 8.3. Once the rise in prices is taken out, the legal minimum therefore gained 175% in purchasing power. That's a real gain, and it's what we call purchasing power. When we say "allowing for prices", the rise in prices has already been removed.
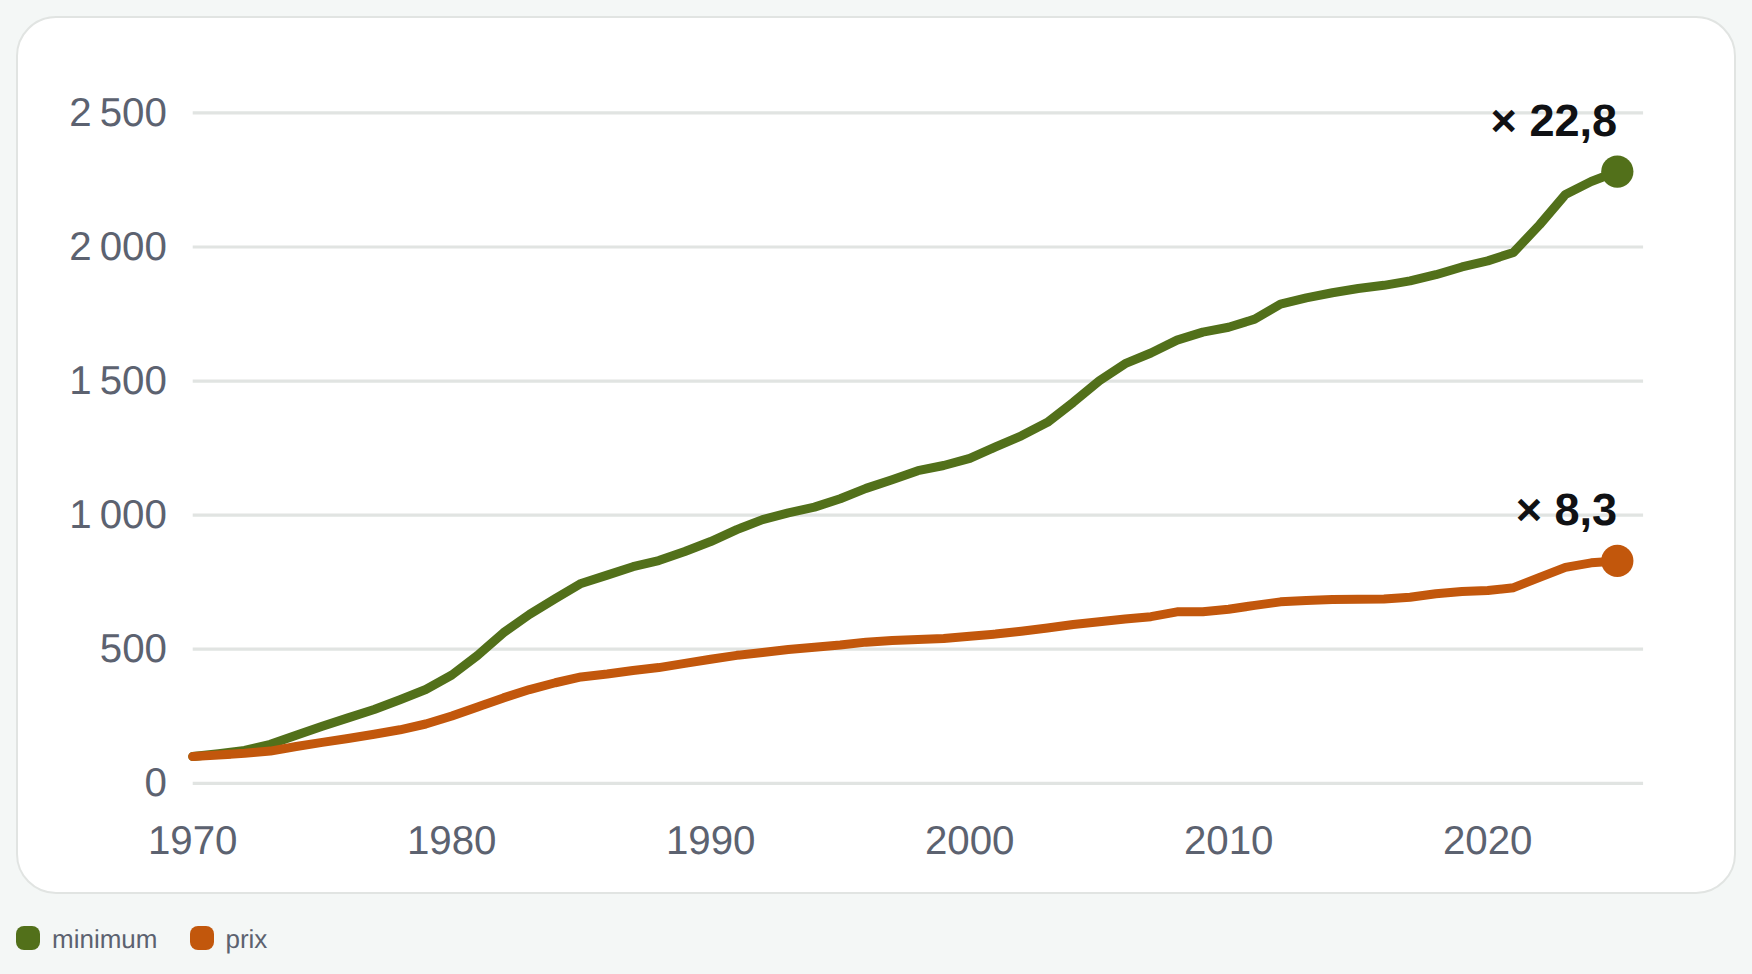
Over these 55 years, the SMIC lagged behind prices in only 5 years. In 2025 euros, an hour of gross SMIC was worth €4.32 in 1970, €8.43 in 1990 and €11.88 today. It almost doubled between 1970 and 1990 (× 1.95), then rose about 41% between 1990 and 2025 (× 1.41). Most of the catch-up therefore dates from the first two decades.
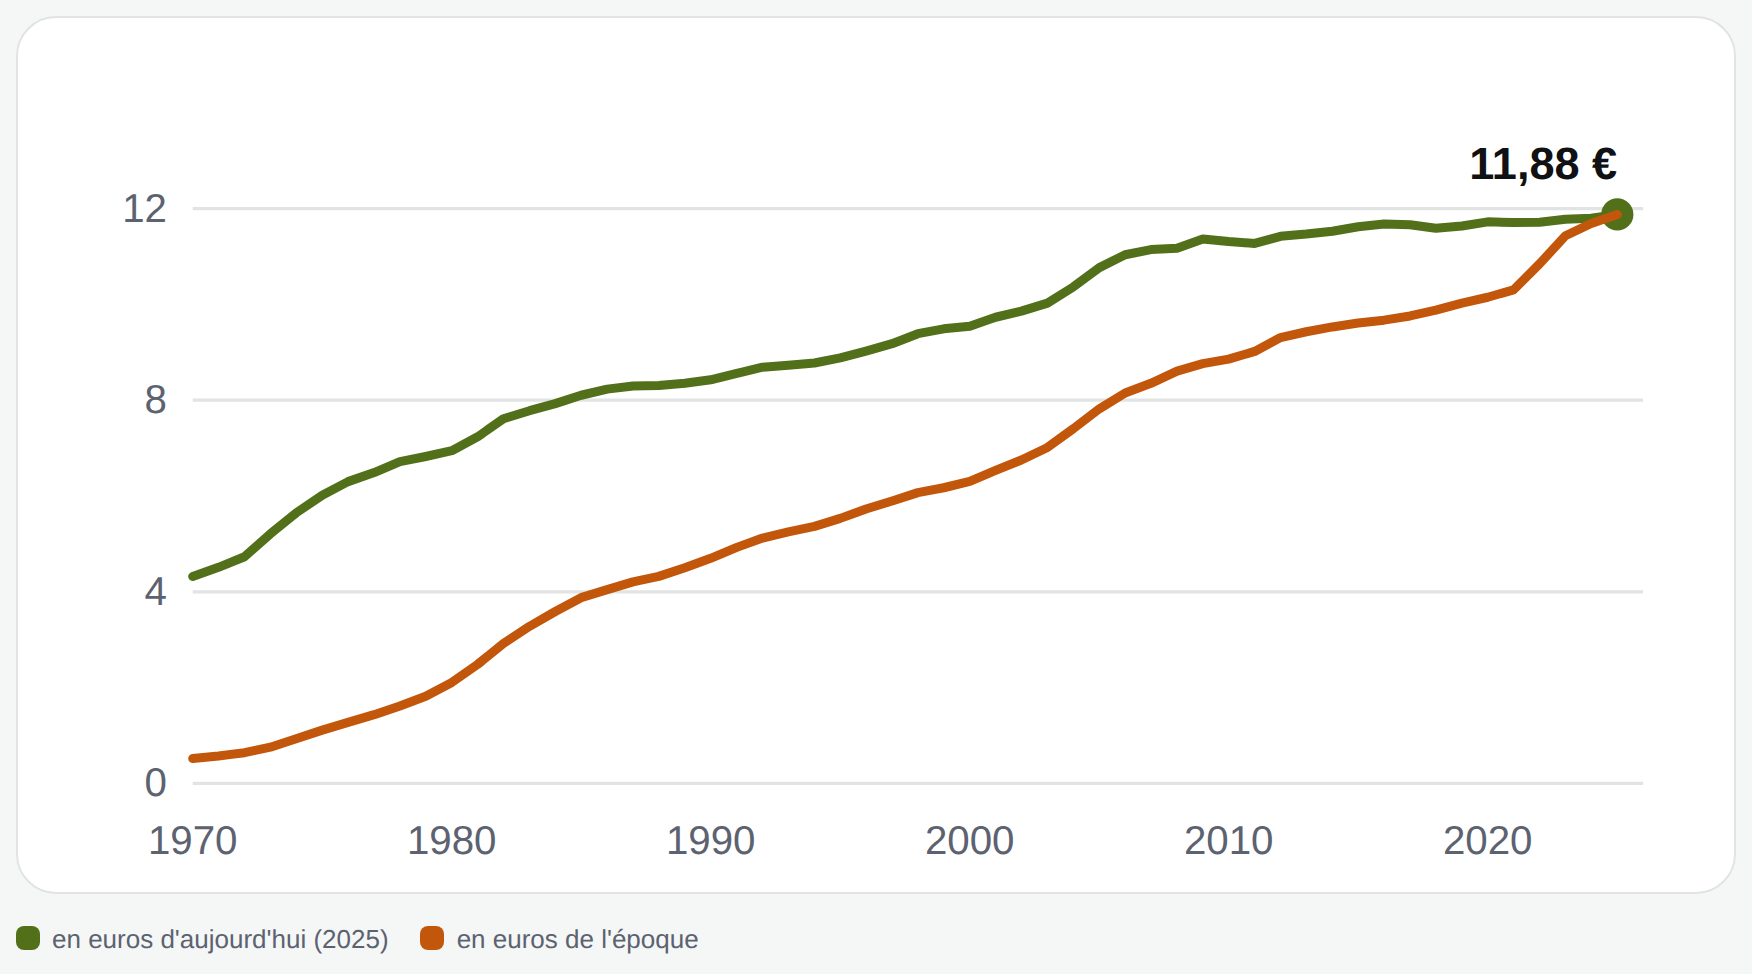
Note that we're talking about the SMIC here, which is a floor. We see nothing of the wages above it, nor of what an average household earns.
And in practice, what does an hour of SMIC buy?
The calculation is simple: for each period, we compare what an hour of SMIC of that time bought at the prices of that time. For example, how much bread an hour of SMIC paid for in 1970, then how much it pays for in 2025. Result: 2.7 times more than in 1970, across all prices. But it depends a lot on what you buy. An hour of SMIC buys 2.6 times as much electricity or rent (in the sense of the rent index)… and only 1.2 times as much town gas.
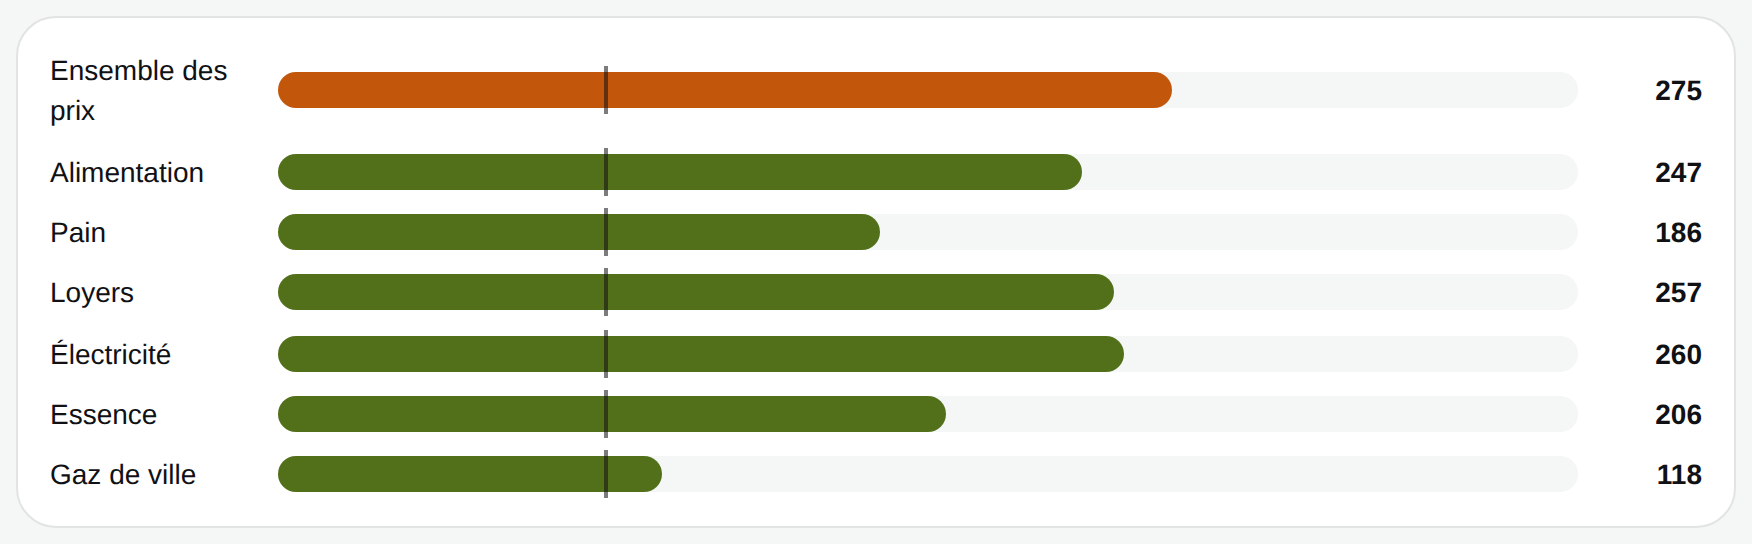
Bread groups bakery and pastry products until 1990, then bread as defined by the European classification; gas is town gas, not a full heating cost.
Once the compulsory spending is paid, how much is left?
So far, it was rather reassuring. But it gets more complicated.
There are nearly compulsory expenses, which you pay before having decided anything: housing, energy, insurance, telecoms and other contracts. Insee calls them "pre-committed" spending. In 1960, they made up 13.5% of households' disposable income. In 2024: 30.3%. Of which 22.8% for housing, against 10.7% in 1960.
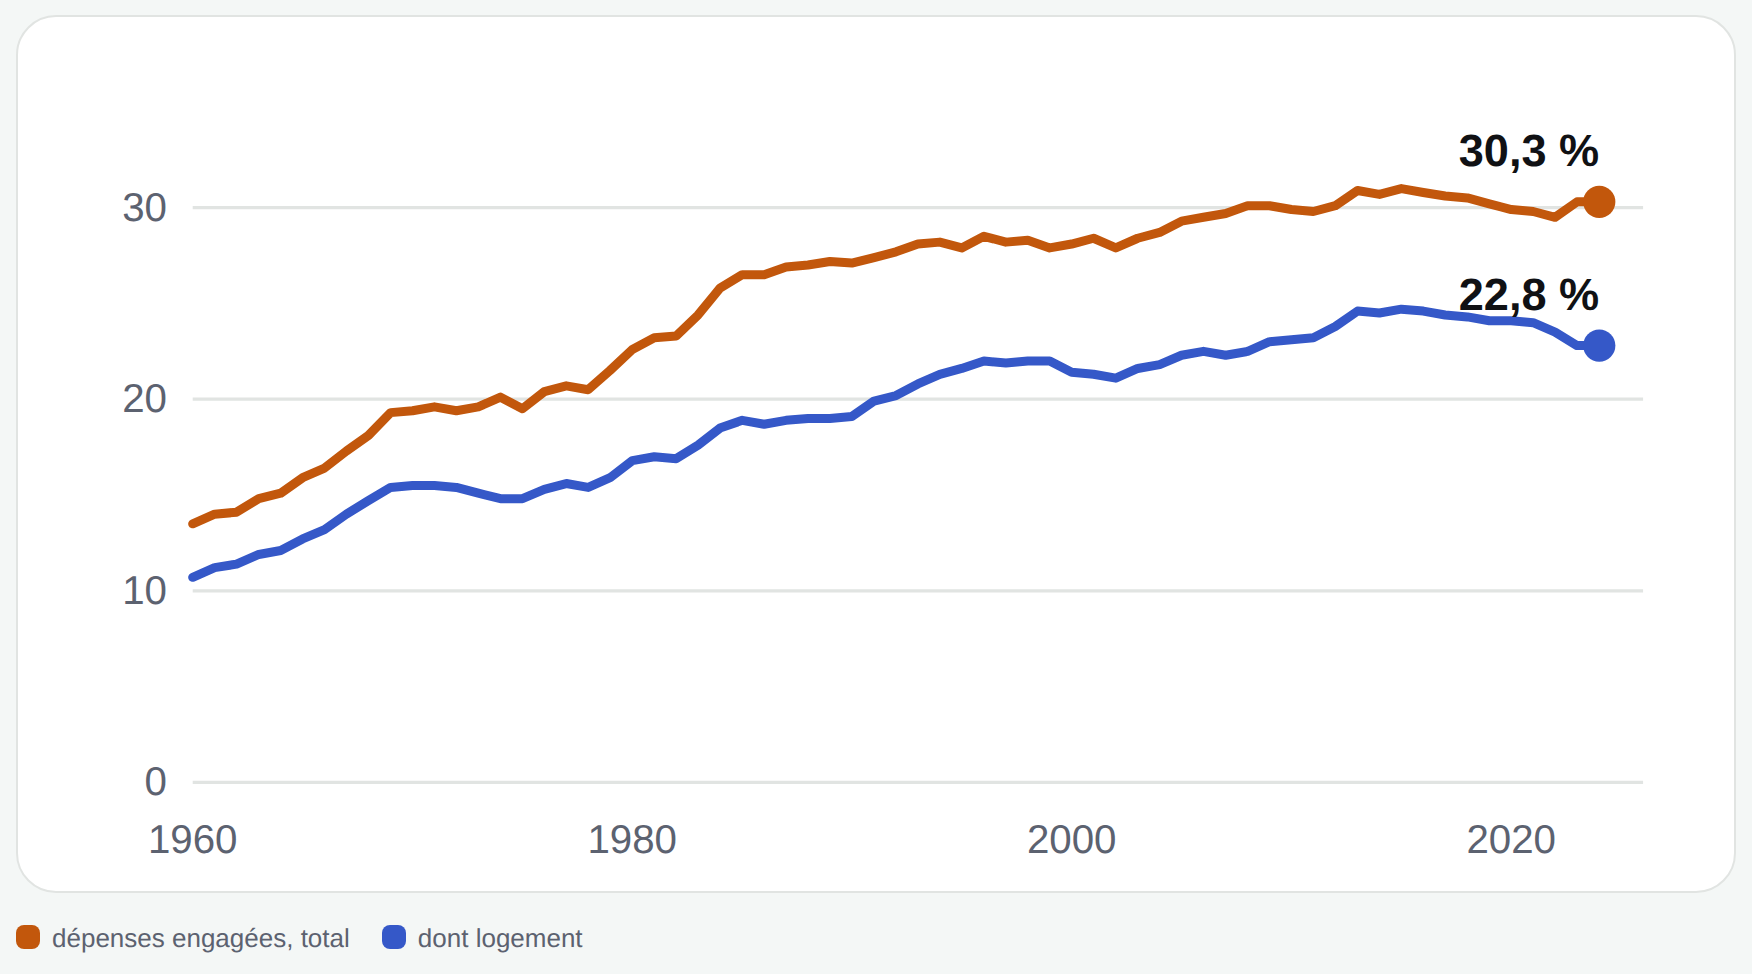
That doesn't mean income stagnated, quite the opposite: per person, allowing for prices, it was multiplied by 3.2 between 1960 and 2024. Once committed spending is taken out, what remains was multiplied by 2.6. Since 2000, income has gained 23% and what remains, 19%.
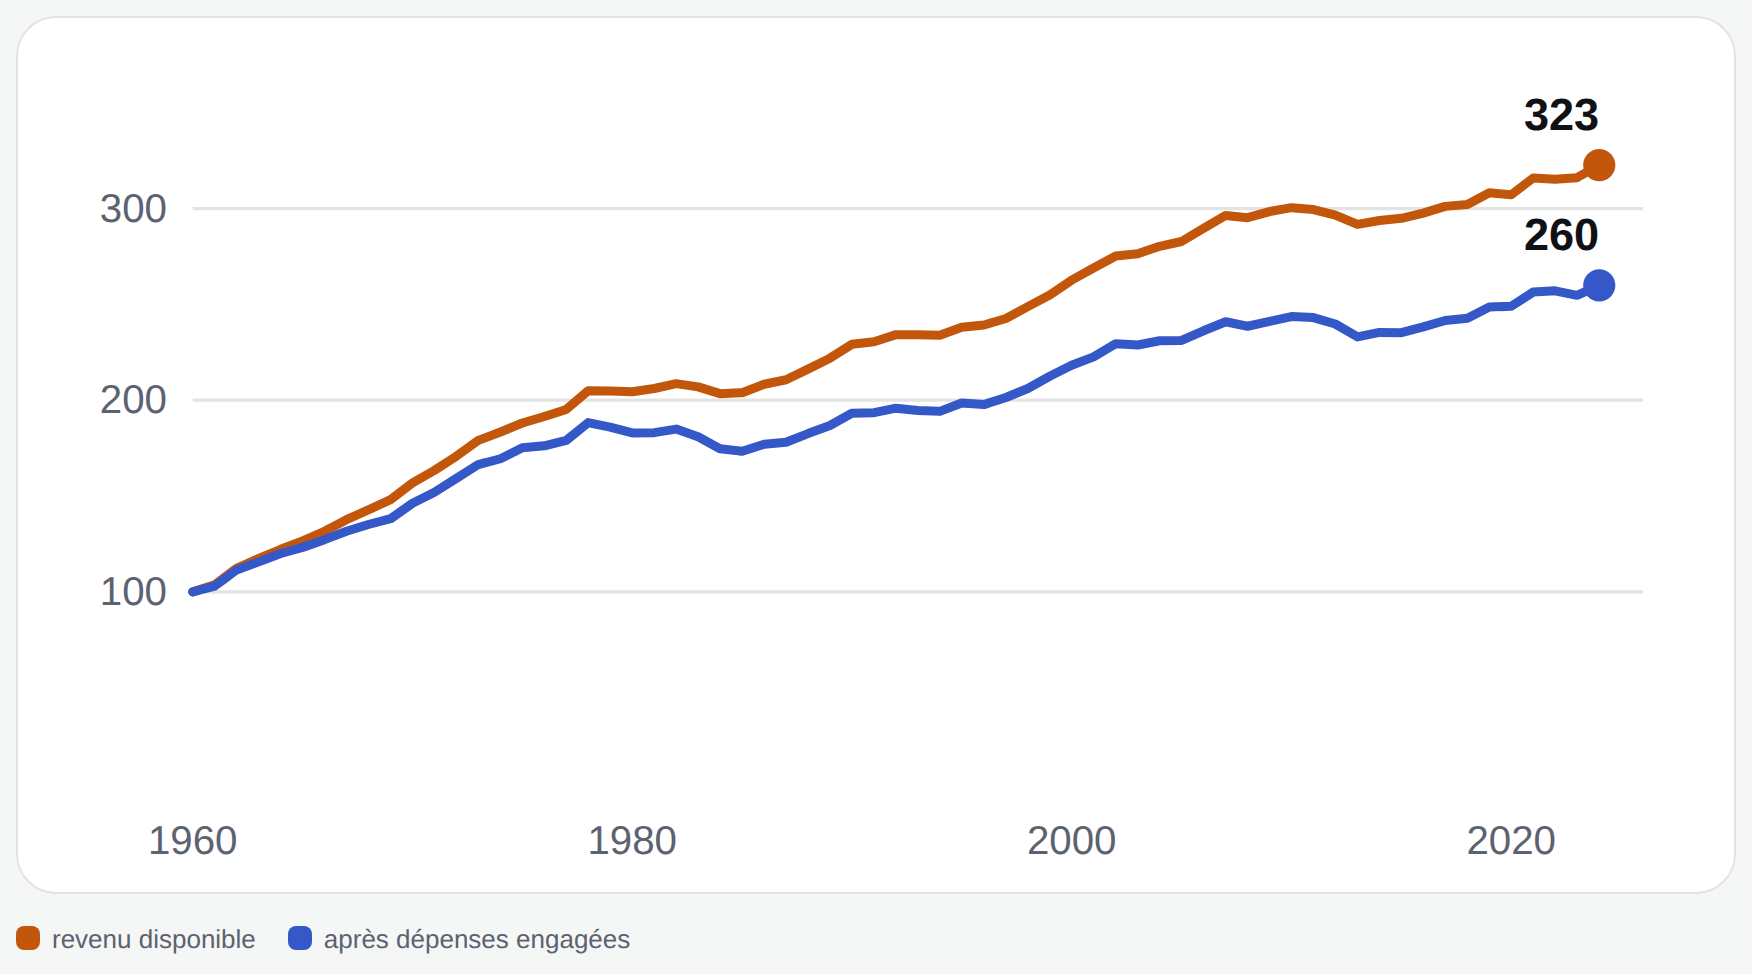
Note that we're talking about an average household here. We're not talking about a household on the minimum wage. (Chart labels are in French.)
And the "remainder" is not what's left to live on: it's what pays for eating, getting around, healthcare, saving.
"Rent weighs more heavily"
Here, there are two ways to measure, and they don't read together.
The first is the share of tenants' income that goes on rent and charges, after housing benefits are deducted. In the private sector, it goes from 17.3% in 1984 to 27.3% in 2013; in social housing, from 15.1% to 22.5%. The most recent measure dates from 2013: there is no more recent figure to show you.
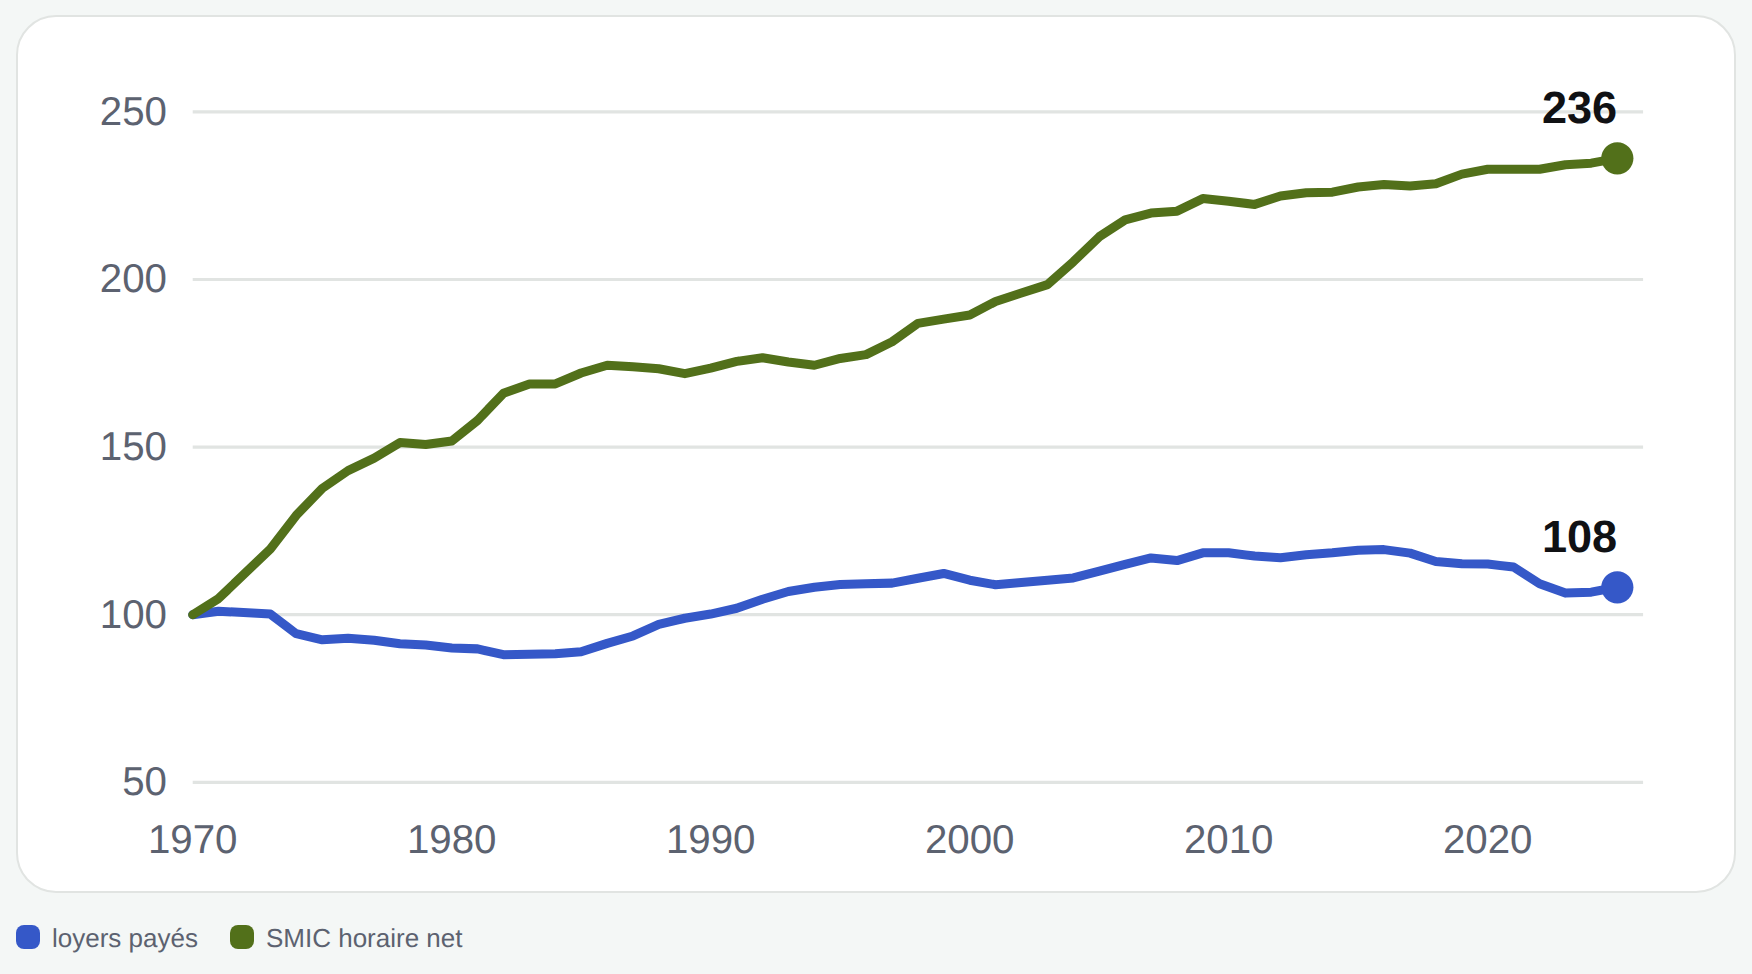
The second compares, since 1970, the rents paid by all tenants with the net hourly SMIC, both allowing for prices. Result: rents rose 8% more than prices, and the net SMIC was multiplied by 2.36. But note: this measure doesn't say what a new tenant pays, who often pays more.
And the price of a home, against incomes?
Relative to an average household's disposable income, the price of existing homes was multiplied by 1.69 between 1970 and 2025. The low point is in 1975, the high point in 2022. In concrete terms: an average home is worth 3.8 years of an average household's income, against 2.2 in 1970.
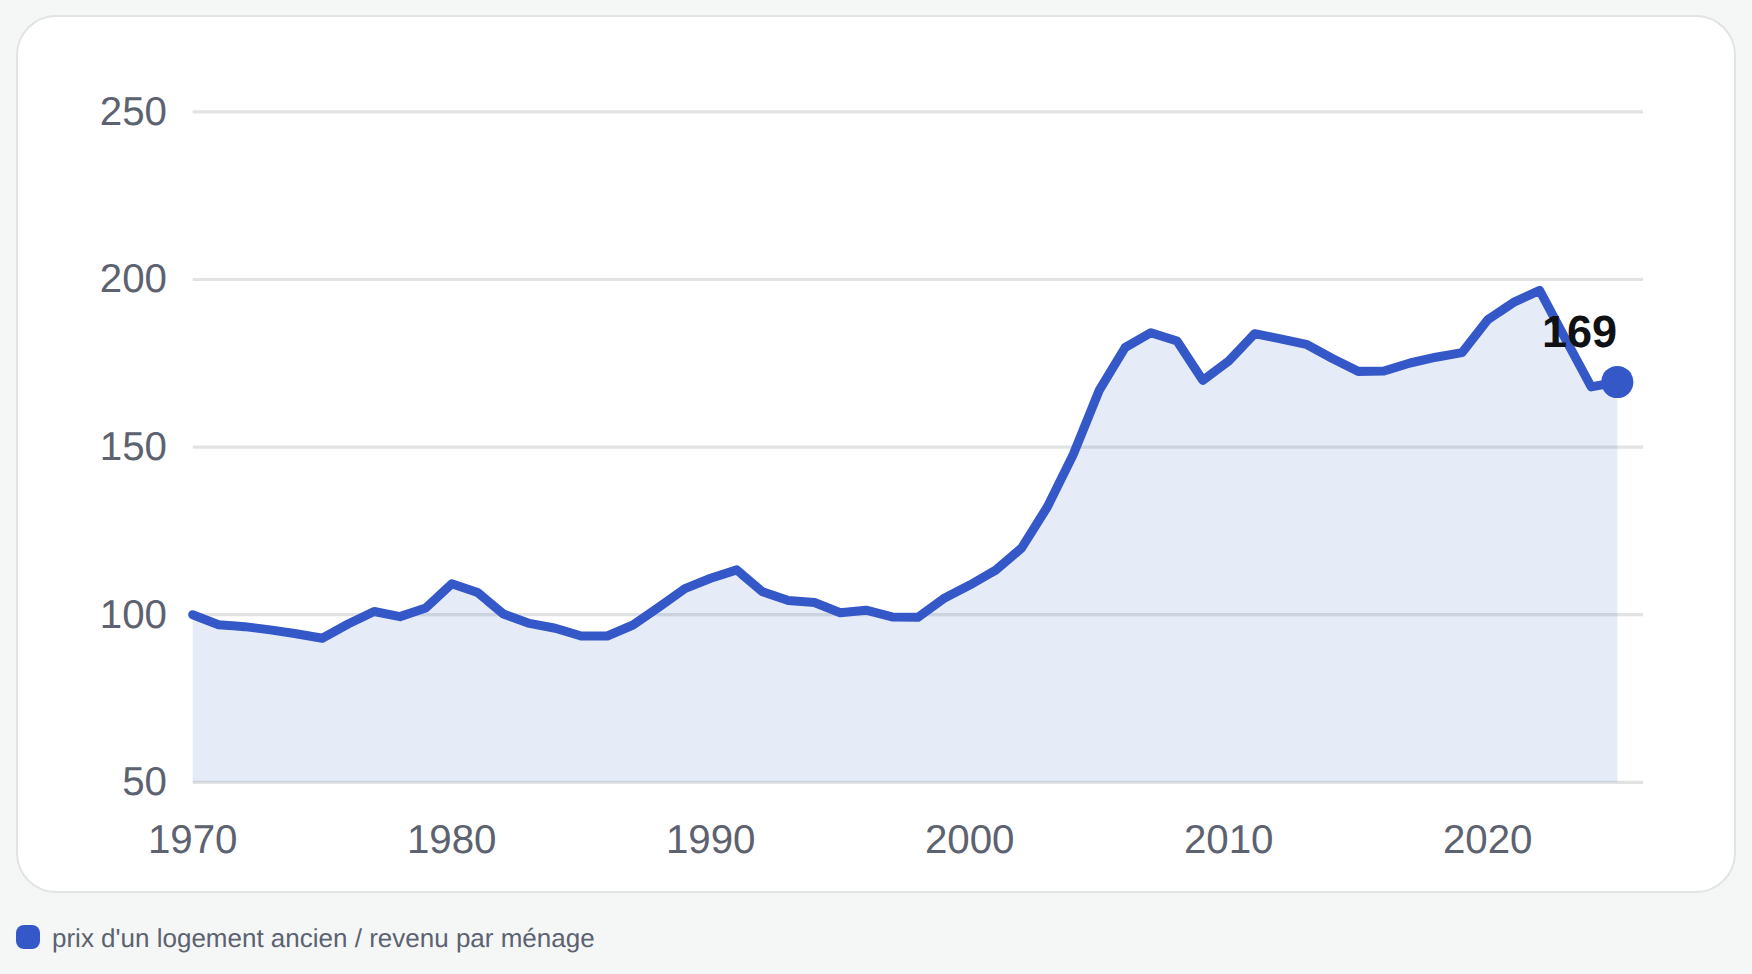
But look at what it gives with the full-time gross SMIC: the same average price represents 10.4 years of SMIC in 2025, against 10.9 in 1970. Almost stable. The two benchmarks don't tell the same story: the annual SMIC rose faster than average income per household, whose evolution also depends on household size.
And each month, how much does it weigh?
The price in years of income doesn't tell you what you pay each month, because that also depends on the loan rate and its duration. So we calculated the monthly payment for a household on average income buying an average home, with a 10% down payment and a loan on each year's terms.
An example speaks better than any explanation. In 2008 as in 2019, the average home cost the same number of years of income: 4.3. Yet the monthly payment represented 30.6% of income in 2008, against 20.6% in 2019. Between the two, the average loan rate went from 4.99% to 1.35%, and loans got almost two years longer.
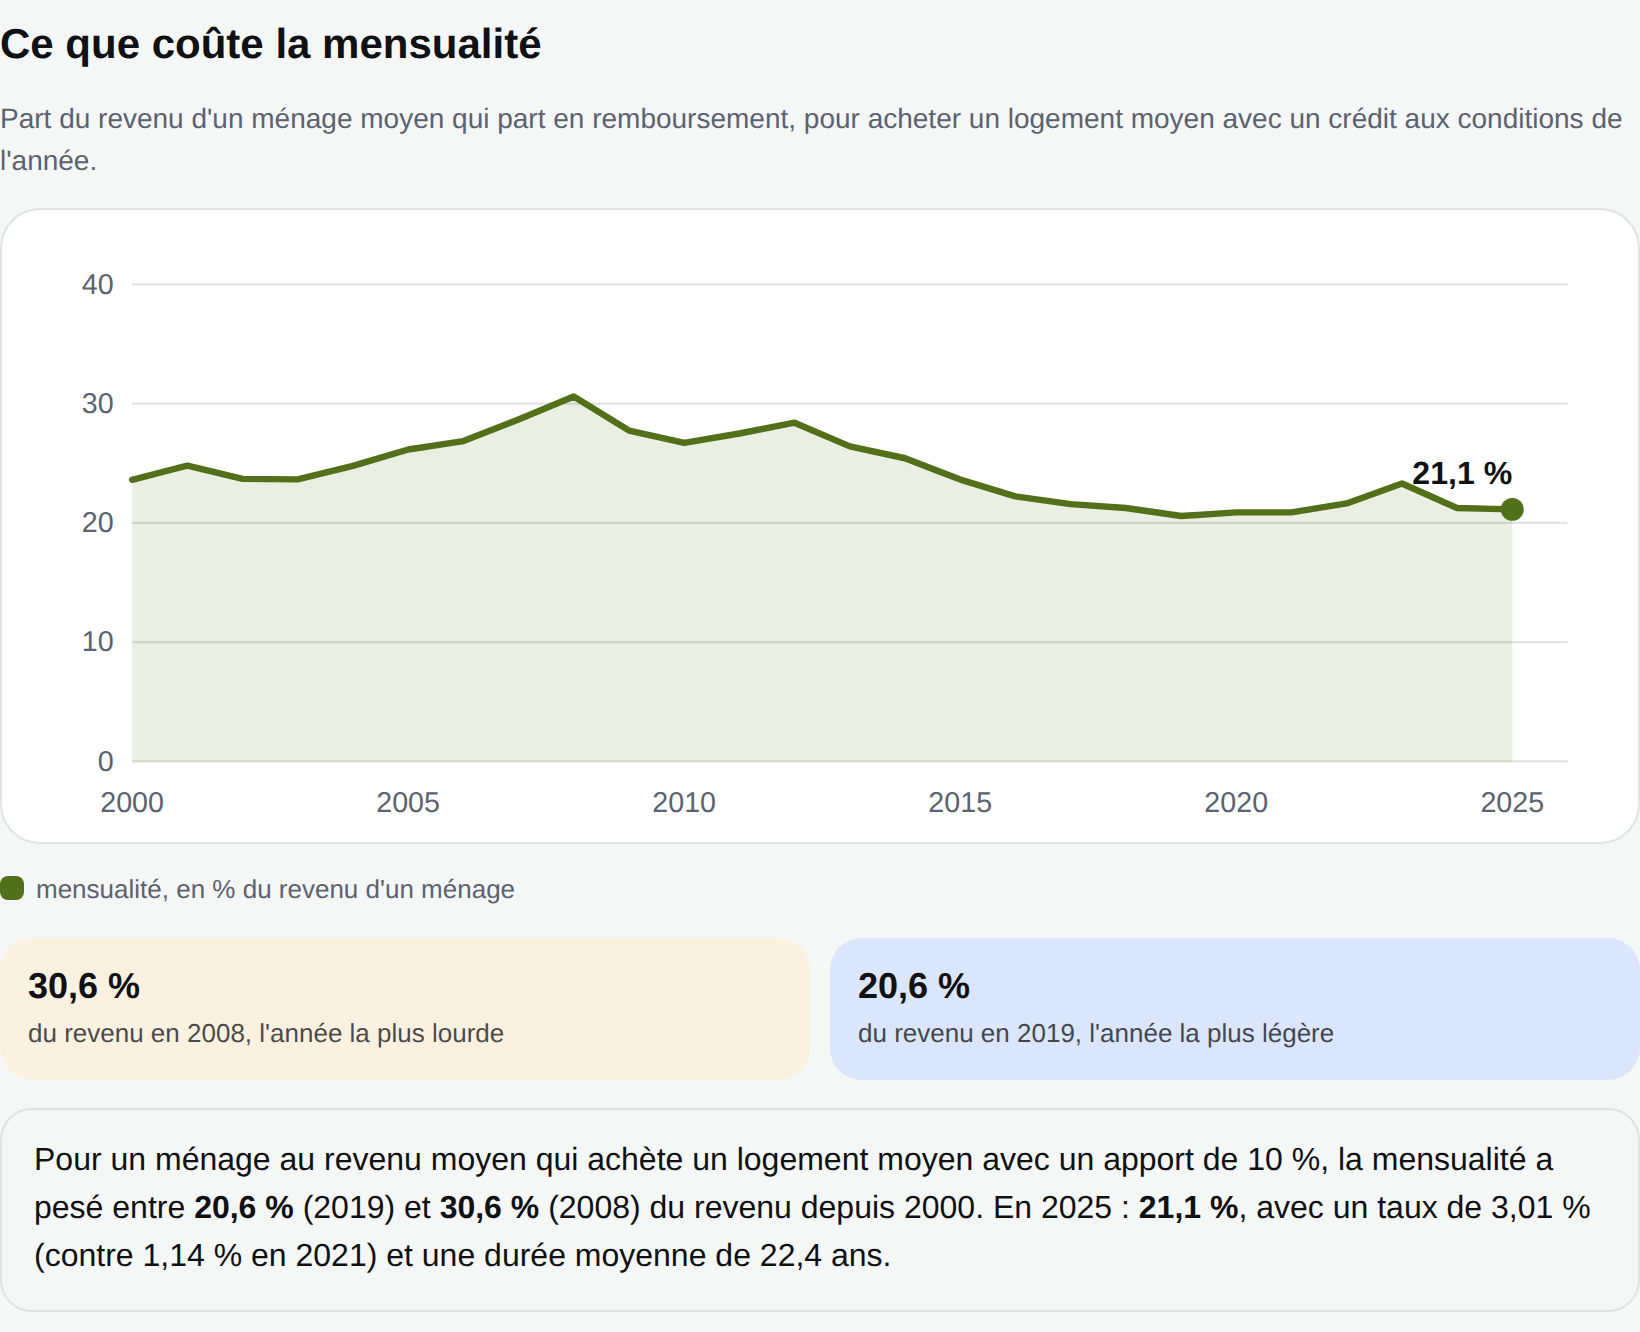
Since 2021, rates have gone back up, from 1.14% to 3.01% in 2025. The monthly payment, though, stays around 21% of income. On one hand, the average home represents slightly fewer years of income than in 2021 (3.8 against 4.5); on the other, loans last slightly longer (22.4 years on average).
What these numbers don't say
Before concluding anything, here are the limits, because they matter as much as the curves:
- A household on the minimum wage is not an average household. Committed spending and income per person concern the average of all households.
- The monthly payment is calculated for an average household. Households that borrow generally earn more than average: for them, the real share is lower. Loan insurance, notary fees and renovation work aren't counted. And the price-to-income ratio says nothing about the loan.
- Homes have changed. On average, a home offered 40 m² per person in 2013 against 31 m² in 1984, and more than one home in four lacked basic sanitary comfort in 1978 against about 1% in 2013. The price index corrects part of these quality changes, but not the fact that today we aim for a higher "minimum" standard of living (computer, mobile phone, internet access).
- The price index tracks a fixed basket. It is not an index of each person's cost of living.
- The values stop at 2025. The SMIC has been raised since, and no recent data exist for the rent share of tenants' income (2013).
- Differences between regions are large, and the figures above are averages for the whole of France.
So, does everything cost more or not?
Both hold together. Against prices, the SMIC has clearly progressed. At the same time, unavoidable spending has more than doubled as a share of household income, and an average home represents more years of income than in 1970, even though the monthly payment depends as much on the loan rate and duration as on the price. What you feel and what the averages say aren't opposed: they don't measure the same thing.